Learn more about your network connection status with iftop, nethogs, and vnstat.
You can use this three Linux commands to get a lot of information about the current network. Iftop tracks network connections by process number, nethogs quickly tells you which processes are taking up your bandwidth, and vnstat runs in the background as a good lightweight daemon and keeps track of your network usage in real time.
Iftop
The acclaimed iftop can listen to the network interface you specify and render it in top style.
This is a nice little tool that can be used to find out network congestion, speed and maintain total network traffic. It's often amazing to see how much bandwidth you're using, especially for those of us who still remember phone lines, modems, "high speed" to the astounding kb and real-time baud rate. We stopped using the baud rate a long time ago and turned to the bit rate. The baud rate is used to measure signal changes, although sometimes it is the same as the bit rate, but in most cases it is not.
If you only have one network interface, just run iftop directly. However, iftop requires root privileges:
$sudo iftop
If you have multiple network interfaces, specify the interface you want to monitor:
$sudo iftop -iwlan0
Just like the top command, you can change the display options while the command is running:
h Switch the help screen.
n Whether to resolve the domain name.
s Switches the display of the source address, and d switches the display of the destination address.
S Whether to display the port number.
N Whether to resolve the port; if the resolution is turned off, the port number is displayed.
t Switch the text display interface. The default display method requires ncurses. I personally think that the display of Figure 1 is more organized and readable.
p Pauses the display update.
q Exit the program.
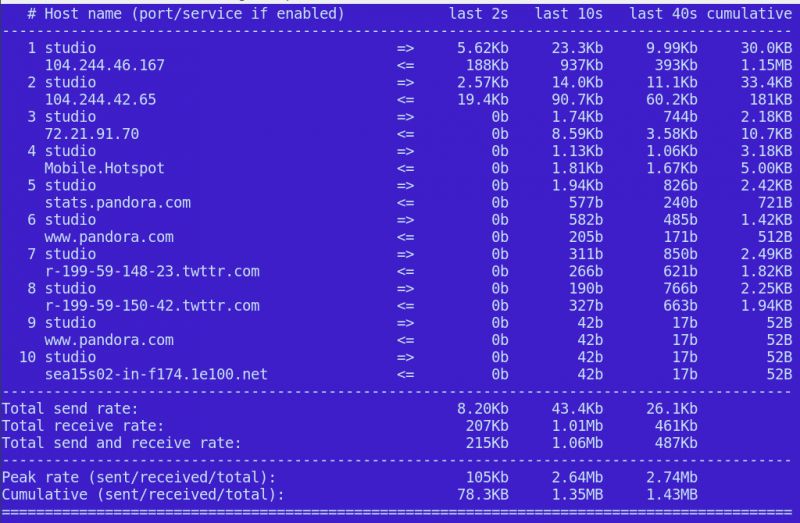
Figure 1: Organized and readable text display.
When you switch display settings, iftop does not interrupt monitoring traffic. Of course you can also monitor a single host. This requires the host's IP address and subnet mask. Now, I am curious as to how much load Pandora can bring to my poor bandwidth. So I first used the dig command to find their IP address:
$digApandora.com
[...]
;;ANSWER SECTION:
Pandora.com. 267 IN A 208.85.40.20
Pandora.com. 267 IN A 208.85.40.50
What about the subnet mask? Ipcalc will tell us:
$ipcalc -b208.85.40.20
Address: 208.85.40.20
Netmask: 255.255.255.0 = 24
Wildcard: 0.0.0.255
=>
Network: 208.85.40.0/24
Now provide the IP address and subnet mask to iftop:
$sudo iftop -F208.85.40.20/24 -iwlan0
Great, isn't it? And I was surprised to find that Pandora uses about 500kb per hour on my network. And like most streaming services, Pandora's traffic is growing rapidly and relies on caching to stabilize.
You can do the same for IPv6 addresses with the -G option. Check out the friendly man to help you understand other iftop features, including customizing your default options with personal profiles and using custom filtering (see PCAP-FILTER for filtering guidelines).
Nethogs
Nethogs is a quick and easy way to quickly understand who is drawing your bandwidth. You need to run as root and specify the interface to listen on. It will show you a lot of applications and their process numbers, so you can kill any process if you want.
$sudo nethogs wlan0
Nethogs version0.8.1
PID USER PROGRAM DEV SENT RECEIVED
7690carla /usr/lib/firefox wlan012.494556.580KB/sec
5648carla.../chromium-browser wlan0 0.052 0.038KB/sec
TOTAL 12.546556.618KB/sec
Nethogs does not have many options: it loops between kb/s, kb, b, mb, sorts the received and sent packets, and adjusts the refresh delay. See man nethogs for details, or run nethogs -h.
Vnstat
Vnstat is the easiest to use network data collection tool. It is very lightweight and does not require root privileges. It runs as a daemon in the background, so you can record your network data in real time. A single vnstat command can display the accumulated data.
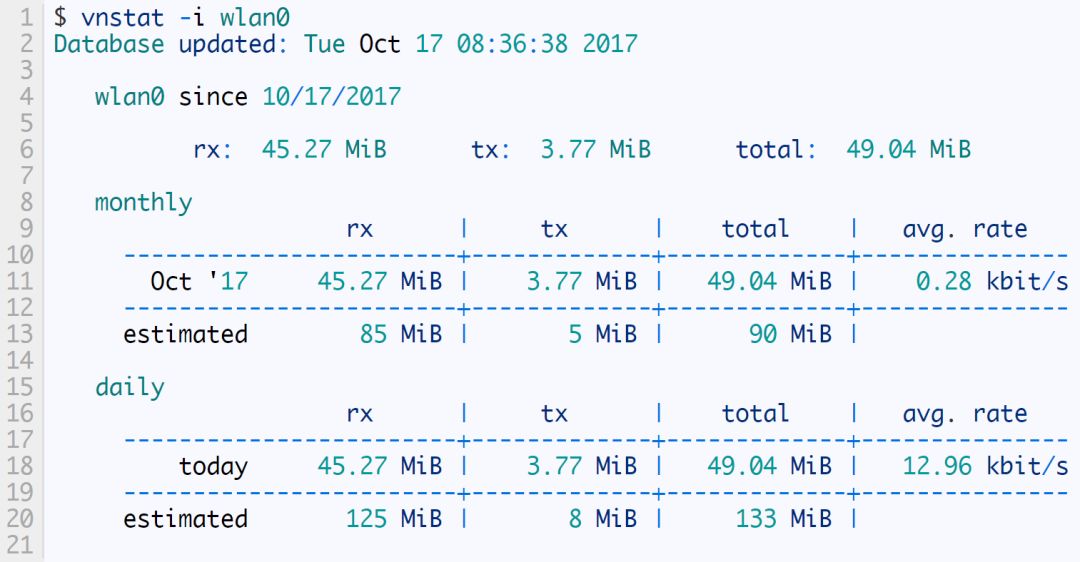
By default it will show all network interfaces. Use the -i option to select an interface. You can also merge data from multiple interfaces like this:
$vnstat -iwlan0+eth0+eth1
You can filter the data display in several ways:
-h Displays statistics by hour.
-d displays statistics by day.
-w and -m display statistics by week and month, respectively.
Use the -l option to see live updates.
The following command will delete the wlan1 database and no longer monitor it:
$vnstat -iwlan1 --delete
The following command will create an alias for one of your network interfaces. This example uses a wired interface name for Ubuntu 16.04:
$vnstat -u -ienp0s25 --nick eth0
By default, vnstat monitors eth0. You can modify it in /etc/vnstat.conf or create your own personal profile in your home directory. See man vnstat for a complete guide.
You can also install vnstati to create a simple color map (Figure 2):
$vnstati -s -iwlx7cdd90a0a1c2 -ovnstat.png
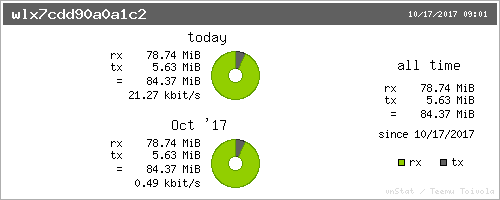
Figure 2: You can use vnstati to create a simple color map.
China leading manufacturers and suppliers of DC Support Capacitors,DC Capacitor, and we are specialize in Electrolytic capacitor,High Voltage Capacitor, etc.DC Support Capacitors
DC Support Capacitors,DC Capacitor,Electrolytic Capacitor,High Voltage Capacitor
YANGZHOU POSITIONING TECH CO., LTD. , https://www.cnpositioning.com