0 Preface
This article refers to the address: http://
The use of reverse engineering in product design and development can greatly shorten the product development cycle and development costs, especially in China's automotive industry. Many of the cover molds are imported directly from abroad, and the design data of these molds is scarce. Retrofitting or localization of car covers, using reverse engineering is a fast and effective method.
Reverse engineering can generally be divided into four stages: (1) digitization of the prototype's prototype. Usually, a measuring device such as a coordinate measuring machine (CMM) or a laser scanning device is used to obtain three-dimensional coordinate values ​​of the surface points of the original surface of the part. (2) Extract the geometric features of the prototype from the measured data. According to the geometric properties of the measured data, it is segmented, and the geometric feature matching and recognition method is used to obtain the design and processing features of the prototype. (3) Reconstruction of the prototype CAD model of the part. The segmented 3D data is fitted to the surface model in the corresponding software system, and the CAD model of the original surface of the part is obtained through the intersection and splicing of each surface piece. (4) Inspection and correction of reconstructed CAD models. The method of re-measuring and processing the sample according to the obtained CAD model is used to verify whether the reconstructed CAD model satisfies the requirements of accuracy or other test performance indexes, and the above process is repeated for those who do not meet the requirements until the design requirements of the parts are reached. The identification and extraction of physical geometric features is the key and difficult point in the whole process.
In reverse engineering, because most of the physical shapes are more complicated, especially there are a lot of free surfaces.
It is usually not possible to fit all data points with a single entire surface. This requires extracting the surface features, dividing the point cloud into a number of meaningful regions to be processed separately, and fitting different surfaces by different methods; then, by intersecting and cutting, connecting the surfaces with the transition surface, and finally forming the whole Zhang Guangshun's surface model. The division of the surface directly affects the construction method of the surface, the splicing of the surface, the stitching of the surface, and the establishment of the solid model. Whether the constructed surface can reflect the characteristics of the original object depends largely on the quality of the slice.
In the currently used surface configuration software, data segmentation is generally performed by an interactive method: the user analyzes a certain data set by observing the original data point cloud, finds each feature from it, and interactively borders it. To define, and then reconstruct the single surface by using the corresponding surface reconstruction method for the obtained data piece. Then connect the various configuration surfaces through a common boundary line or transition surface. This method is relatively straightforward to implement, and many commercial software currently use this method. Such as surfacer. Although the method is intuitive and simple, it has great deficiencies. Using user-interactive data interval definitions, there is a lot of randomness in the actual process. The determined boundary is relatively ambiguous. Usually, the data is roughly divided firstly, and then it is repeatedly modified, deleted, and even reconstructed according to the observation of the fitting surface condition and the detection result of the error and the smoothness. This kind of practice is time consuming, the efficiency is relatively low, and the results of different observations may vary from observation to person. This requires a certain level of practical experience and geometric configuration, which is a process of exploration and experimentation. The original features of the surface are not well protected and reflected, and the results obtained may not meet the requirements of the user. Therefore, the automatic extraction of prototype features to divide data has always been the goal pursued by people.
Many people at home and abroad have studied the feature recognition of physical prototypes and automatic segmentation of surfaces [3-4], but most of the algorithms are more complicated and difficult to implement. Some of them are mainly for rule data point clouds, and they are not really achieved. Automating the shards.
By extracting the topological structure of the scattered data points, the triangle meshing of the data points is completed; then the data is reduced, the normal vector and the curvature of each measured point are estimated, and the curvature extreme points are used as the boundary feature candidate points; Form the boundary line. The algorithm was applied to the Shanghai Volkswagen SAN mold digitization project and achieved good results. 
1 Create a triangular mesh model
The data measured by optical equipment has a large amount of point cloud data, and the data arrangement has no obvious organizational structure. For such a point, we use Riemann diagram to establish the adjacency relationship between scattered data points [5], and then use the principle of minimum internal angle maximization [1] ] Complete the triangular network of data points. 
2 Surface normal vector and curvature solution
For a given polyhedron, the normal vector npi at a vertex Pi is usually calculated using a weighted combination of all plane unit normals ni adjacent to it [1].
In practical applications, the weight λi usually has the following methods:
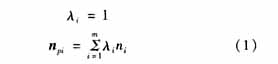
In fact, this algorithm is the simplest algorithm. The contribution of each relevant plane to the common vertex normal is equal, similar to the calculation formula in the case of planes. The advantage is that the calculation is very simple, but there is no obvious geometric meaning. 
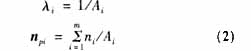
Where Ai represents the area of ​​the associated triangle, the larger the area, the smaller the contribution of the plane normal vector to the common vertex normal vector.
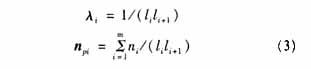
Where li is the associated side length, it can be seen that the longer the two related edges of the triangular plane, the smaller the contribution of the plane normal vector to the common vertex normal vector.
Here, using the area of ​​the triangle as the weighting factor, the point normal vector is calculated by the weighted average of several triangular normals around the point. After the data points are triangulated, there are m points Pi (I=1, 2, ... m) adjacent to the point P0, which are called the neighborhood point set of the point P0, and each of the m triangles The plane has m unit normals n1, n2, ... nm. The normal vector of a triangle composed of P0, Pi, Pi+1 is ni:
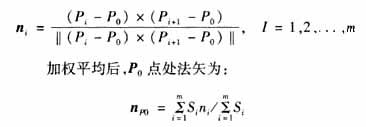
Using this method to estimate the normal vector is simple
. In the process of programming, in addition to estimating the law of each point, it also allows each point to carry its own vector to improve the flexibility of data processing [2].
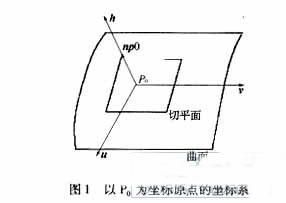
After obtaining the normal vector of the neighborhood point set at P0 point, the local point set can be locally parameterized [3]. Since the curvature value of the point is to be estimated, the local parametric surface generally uses a quadratic or more surface. Through practice, it is better to use the local paraboloid fitting method for spatially scattered data. In the process of parameterization, when P0 is selected as the coordinate origin, the surface equation for local parameter fitting can be expressed as h(u,v)=au2+buv+cv2, and the h coordinate axis and the surface are selected at P0. The direction of the normal vector nP0 of the point is the same, and the other two coordinate vector u, v are located in the tangent plane of the point P0. Then the frame composed of the three is δ=(u, v, nP0). The coordinate system they form is an affine system [2]. For example, u, v is the main direction of point P0, and its corresponding principal curvature is k1, k2 (see Figure 1).
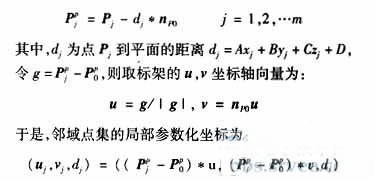
According to the normal vector nP0, the tangent plane equation of the vector point P0 is:
![]()
From this, the projection coordinates of the vector point Pj on the plane are:
After the coordinate local parameterization of the neighborhood point set is completed, the weighted least squares principle can be applied to perform surface fitting on the neighborhood point set. Then use the Gauss-Adam elimination method to obtain the best parameter estimates a*, b*, c* for the problem. So can
The approximate surface of the neighborhood point set is h(u,v)=a*u2+b*uv+c*v2. From this it is possible to derive the approximation of the principal curvature and the main direction of the point.
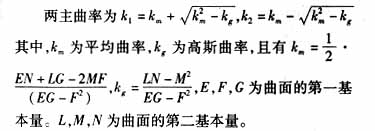
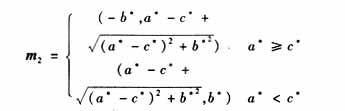
The main direction of the surface in P0 can be solved by the equation given by:
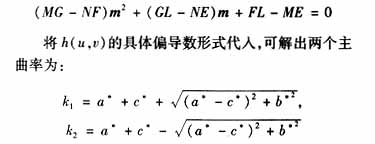
The corresponding main direction is:

After obtaining the curvature of each point, the curvature extreme point is taken as a candidate point of the feature point. 
3 extraction of boundary points
The boundary points on a curve can be divided into step boundaries (height discontinuity), wrinkle boundaries (tangential discontinuities), and smooth boundaries (curvature discontinuities).
Take the curvature extreme point or zero crossing point (for the first boundary line) as the boundary point of the discrete surface. The basic ideas are as follows:
(1) First select a candidate boundary point P, and take the nearest two adjacent points T1, T2 along the main direction m1 at both sides of the point, and find their curvatures KT1, KT2 along the m1 direction. If k1 is greater than KT1, KT2 then the point is the maximum curvature extreme point.
(2) Similarly, select the main direction m2, take the adjacent points T3, T4 along the main direction on both sides of the P point, and find their curvatures KT3, KT4 along the m2 direction. If k2 is smaller than KT3, KT4, the point is the minimum curvature. Extreme point.
(3) By performing the above operations on all candidate points, all the required boundary points can be obtained.
After the boundary points of the data points are extracted, the boundary points can be organized to remove the pseudo-boundary points, and an ordered-edge coded list algorithm is used to form an ordered entity boundary contour map [4]. In the actual reverse, the extraction of the closed boundary can be divided into two steps. The first is the extraction of single boundaries; the second is to track the single boundaries in sequence to form a closed boundary. The algorithm can further realize the automatic degree of boundary feature extraction. However, in the reverse design of the automobile cover mould, the transition surface is generally a smooth transition, and the curvature change is not very obvious. The boundary contour generated by this algorithm does not really complete the more accurate division of the point cloud. Therefore, in the paper, after the feature points are extracted, the closed boundary feature is generated by human-computer interaction. This not only avoids the above-mentioned shortcomings of relying on human-computer interaction to achieve fragmentation, but also overcomes the shortcomings of adjusting the inconvenience of deviation in the process of purely automatic presentation.
4 Examples and conclusions
The algorithm draws on the methods proposed in the literature and has been improved. The proposed algorithm can be used not only for the extraction of feature points of regular data points, but also for the extraction of feature points by simplifying and triangulating the scattered data points. The advantage of this algorithm is that the structure is clear, the implementation is simple, the method of simple human-computer interaction improves the precision, avoids a lot of attempts to reconstruct the process, and the relative automatic algorithm improves the flexibility of the algorithm. The proposed algorithm is applied in the design of Shanghai Volkswagen's SAN2000 front wall mold through MFC and OpenGL programming. It has achieved good results. Figure 2 and Figure 3 show examples of this method used in SAN2000 front wall mold. First, the ATOS (Advanced Topometric Sensor) non-contact structured light measuring instrument manufactured by GOM of Germany was used to obtain the data points of the mold. Preprocessing of the data is done with surfacer software. Then use the algorithm in the paper to calculate the normal vector and curvature estimation of each data point, extract the boundary feature points, and complete the data segmentation. Of course, the algorithm also has a relatively large limitation. For the smooth transition feature, the complete boundary cannot be obtained well, and it needs to be adjusted through manual interaction. This remains to be seen in future research. 
references
[1] Jiang Shoushan. Peter Eberhard. Numerical Estimation of Vertex Normals of Polygons and Polyhedra. Journal of Computer-Aided Design & Computer Graphics, 2002, 14(8): 763-767.
[2] Zhu Xinxiong. Free Curve and Surface Modeling Technology. Shanghai: Science Press.
[3] Milroy J, Bradley, Vickers G W. Segmentation of a wrap-around model using an active contour. ComputerAided Design, 1997, 29(4): 299-320.
[4] M. Yang, E. Lee. Segmentation of measured point data using a parametric quadric surface approximation. Computer-Aided Design, 1999, 31: 449-457.
[5] Zhang Liyan. Research on Simplified Technology of Massive Measurement Data. Journal of Computer-Aided Design & Computer Graphics, 2001, 11(13): 1019-1023.
Zener Diode, the English name Zener diode, also known as Zener diode. By using the reverse breakdown state of the pn junction, the current can be varied over a wide range and the voltage is substantially constant, and the diode that acts as a voltage regulator is fabricated. [1] This diode is a semiconductor device that has a very high resistance until the critical reverse breakdown voltage. At this critical breakdown point, the reverse resistance is reduced to a small value in this low resistance region. The current is increased and the voltage is kept constant. The Zener diode is binned according to the breakdown voltage. Because of this characteristic, the Zener diode is mainly used as a voltage regulator or voltage reference component. Zener diodes can be connected in series for use at higher voltages, resulting in higher regulated voltages in series.
Zener Diode
Power Zener Diode,Zener Diode,Zener Diode Regulator,Zener Diode 56V
Dongguan Agertech Technology Co., Ltd. , https://www.agertechcomponents.com