At present, more and more embedded development companies and engineers are beginning to use the JTAG ICE simulator to debug the program. The traditional full simulation (Full ICE) is gradually being replaced by a flexible, cost-effective JTAG emulation.
The JTAG emulator currently meets all the basic requirements for embedded program debugging, such as breakpoint settings, single-step debugging, memory editing, variables, register observations, and more. (As shown in Figure 1)

Figure 1 debugger interface and common functions
The breakpoint setting is the most basic debugging feature of the JTAG emulator. The user needs the system to stop after setting the breakpoint. Breakpoints are divided into several different categories depending on the principle and use. This article will briefly introduce the types of breakpoints commonly used.
Breakpoints can be divided into two categories: hardware breakpoints and software breakpoints:
1. Hardware breakpoints require hardware support from the target CPU. The current popular ARM7/9 internal hardware design provides two sets of registers for storing breakpoint information, so the ARM7/9 core supports up to two hardware breakpoints, while ARM11 can. Support for 8 hardware breakpoints. This has nothing to do with the debugger.
2. Software breakpoints are implemented by setting the feature values ​​in the code. When you need to set a software breakpoint at an address code, the emulator will first protect the code here, and then write the pre-set breakpoint feature value (usually 0x0000 and other values ​​that are not easy to be confused with the code). Enter this address to overwrite the original code data. When the program runs to the address where the feature value is located, the emulator recognizes that it is a soft breakpoint and an interrupt is generated. When the breakpoint is canceled, the previously protected code information is automatically restored.
Hardware breakpoints can be set in any location code, including ROM and RAM; software breakpoints can only be set on RAM because they need to modify the value of the corresponding address, but the number can be unlimited. Due to the flexibility of hardware breakpoint settings, it is the most preferred breakpoint resource, but two breakpoints are often difficult to meet the needs of engineers for in-depth debugging, so software breakpoints can be used as a supplemental resource for hardware breakpoints.
Since the usual software breakpoints can only be set in the code running on the RAM, and as the amount of code in the system grows larger, especially in the field of mobile communications, expanding the large-capacity RAM will inevitably increase the cost of the product, so now many The system runs the code directly on the FlashROM. For such a system running code on FlashROM, general software breakpoints cannot be set, which is also a limitation of software breakpoints. For such a system, only two hardware breakpoints can be used alternately to meet the needs, but it will bring some inconvenience.
To solve this contradiction well, only the emulator can increase the function of setting software breakpoints on the FlashROM, and expand the breakpoint resources available in the emulator. For example, Japan's Yokogawa Computer Corporation (YDC)'s latest high-end ARM emulator, advicePRO, is the first ICE emulator product to support Flash breakpoints. (as shown in picture 2)
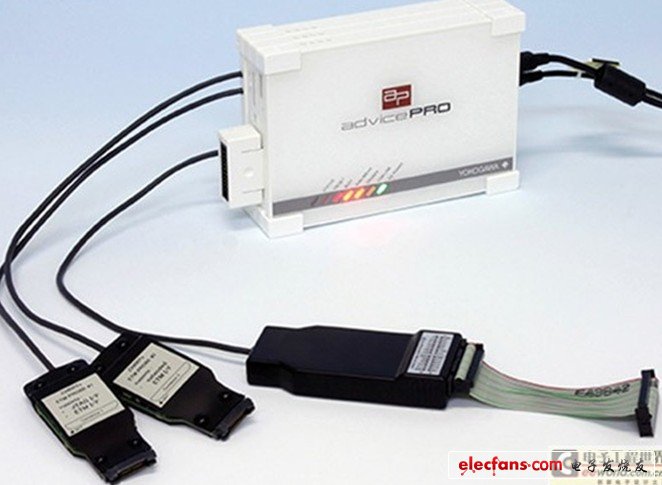
Figure 2 Yokogawa's latest product advicePRO
The principle of setting a software breakpoint on the FlashROM is similar to setting a soft breakpoint on the RAM. It is also to replace the original code with the signature at the set breakpoint, and the breakpoint event occurs by identifying the signature. The difference is that setting the software breakpoint on the FlashROM requires flashing the flash. This requires the emulator to have the Flash programming function and the ability to write the signature in the shortest possible time. By completing this series of read and write operations, engineers who debug code on the FlashROM can get more abundant breakpoint resources, which greatly improves development efficiency.
However, since it takes a certain amount of time to erase the Flash, there is a pause in the execution of the Flash breakpoint. Although this is worse than the software breakpoint on the RAM, this is perfectly acceptable compared to the overall convenience of the engineer's debugging work.
Setting breakpoints for debugging is the most basic debugging method. Choosing an ICE simulator with rich breakpoint resources can significantly improve debugging efficiency. Of course, the premise is that engineers have the flexibility to use a variety of breakpoint resources.
Puff Vape,Puff Bar Disposable Vape Pen,Puff Bars Vape Pens,Puff XXL Disposable Vape
Shenzhen Uscool Technology Co., Ltd , https://www.uscoolvape.com